In the intricate ecosystem of global enterprise communication, Multinational Corporation (MNC) Town Halls represent critical touchpoints for leadership to connect with a dispersed workforce. Beyond mere broadcast, the true measure of a Town Hall’s efficacy lies in its ability to foster genuine engagement, a metric quantifiable through sophisticated streaming analytics. For B2B event streaming specialists, translating qualitative engagement into actionable, data-driven insights requires a profound understanding of the underlying technical infrastructure, data capture methodologies, and advanced analytical frameworks. This article delves into the precise technical mechanisms for measuring and interpreting engagement in enterprise-grade live and hybrid Town Hall productions, moving beyond rudimentary viewer counts to embrace a holistic, data-centric approach that informs strategic communication and optimizes future deployments.
The complexities of delivering a seamless Town Hall across diverse geographical regions, often involving a blend of on-site and remote participants, necessitate robust streaming protocols such as Secure Reliable Transport (SRT) for low-latency, high-quality content delivery over unpredictable networks, or Real-Time Messaging Protocol (RTMP)/RTMPS for broader compatibility with Content Delivery Networks (CDNs). The foundational challenge is not just transmission, but the granular collection of data points across this heterogeneous distribution landscape. Our focus extends to the technical architecture required to capture, process, and visualize engagement data, enabling enterprise decision-makers and AV professionals to truly understand the return on investment (ROI) of their communication initiatives.
Technical Foundations of Engagement Data Capture in B2B Streaming
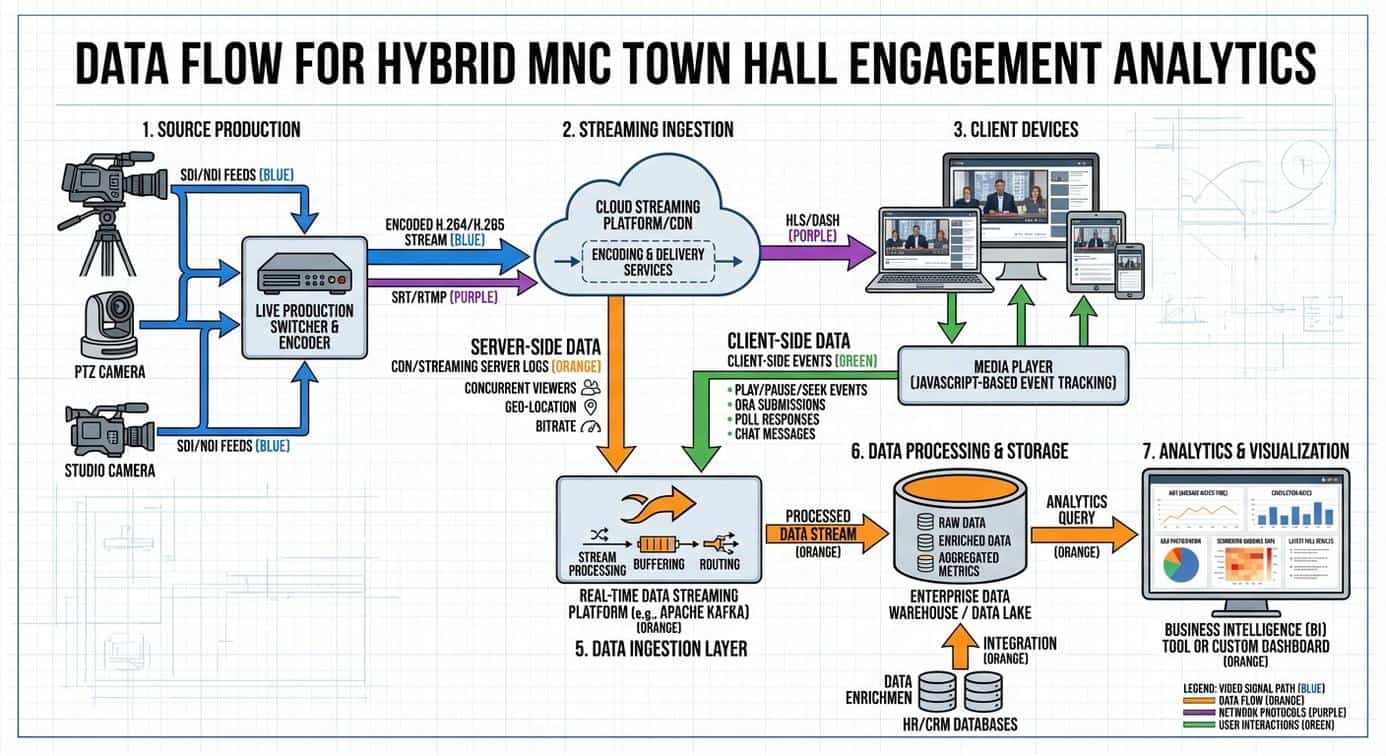
Effective engagement analytics for MNC Town Halls begins at the source, embedded within the streaming and content delivery architecture itself. Unlike consumer streaming platforms with pre-built analytics suites, enterprise B2B environments demand custom-tailored solutions integrated deeply with existing IT infrastructure and security protocols. Data capture mechanisms must account for both server-side and client-side interactions, often necessitating a federated approach.
Server-Side Data Ingestion and Protocol-Level Metrics
Server-side analytics provide foundational metrics derived directly from the streaming infrastructure. When an H.264 or H.265 encoded video stream, originating from a multi-camera production setup utilizing Serial Digital Interface (SDI) or Network Device Interface (NDI) sources, is ingested by a streaming server or CDN, various data points become available. These include concurrent viewer counts, total unique viewers, geographical distribution of viewers via IP address resolution, and total watch time aggregated across all participants. For example, a CDN’s logs will detail requests for manifest files in HTTP Live Streaming (HLS) or Dynamic Adaptive Streaming over HTTP (DASH) protocols, providing per-segment delivery confirmation. More advanced CDN analytics can track buffering rates, average bitrate delivered, and video quality switched for each client based on network conditions, offering critical Quality of Experience (QoE) insights. These data points, while not direct engagement metrics, are vital performance indicators that directly impact a participant’s ability to engage with the content.
Client-Side Event Tracking and User Interaction Data
Client-side data capture is paramount for understanding direct user engagement. This involves JavaScript-based tracking scripts embedded within the web player interface, often adhering to industry standards like the W3C Media Events specification or custom event listeners. Specific events tracked include play, pause, seek, volume changes, full-screen toggles, and duration watched. More importantly for Town Halls, dedicated interactive modules such as live Q&A sessions, polling mechanisms, and sentiment analysis tools generate rich engagement data. For instance, each question submitted in a Q&A module, each vote cast in a poll, or each reaction expressed via an emoji button constitutes a discrete data point. These interactions must be timestamped and associated with a specific user ID, enabling correlation with individual viewing behavior. Integration with Single Sign-On (SSO) systems ensures accurate user identification, crucial for personalized analytics and compliance with enterprise data governance policies.
Metadata Embedding and Content Contextualization
To provide deeper context for engagement metrics, embedding metadata directly into the video stream or associated manifest files is a highly effective technical strategy. Using standards like SMPTE 2021 (ancillary data packets) or private data streams within RTMP/SRT, specific markers can be injected to denote key segments of the Town Hall, such as the CEO’s opening remarks, a specific departmental update, or the Q&A segment. This allows analytics platforms to correlate viewer drop-off or peak engagement precisely with content segments, rather than just aggregate time. For example, if a significant drop in viewer retention is observed immediately after a particular slide presentation, this metadata provides the context to investigate the content or presentation style of that specific segment. Furthermore, embedding speaker identification or topic tags can enable more granular reporting on audience interest in different subjects or presenters.
Advanced Data Aggregation and Analytics Platforms for Enterprise Events
Raw data, irrespective of its granularity, holds limited value without sophisticated aggregation, processing, and visualization. Enterprise-grade analytics platforms are designed to ingest disparate data streams, normalize them, and present them in an actionable format. These are typically not off-the-shelf consumer tools but robust, often custom-built or heavily configured Business Intelligence (BI) dashboards integrated into the corporate data fabric.
Integrating with Enterprise Data Warehouses and BI Tools
The core of advanced analytics for MNC Town Halls lies in integrating streaming data with existing enterprise data warehouses (EDW) or data lakes. Data, captured from CDNs, streaming servers, interactive platforms, and even network monitoring tools, is typically pushed via Application Programming Interfaces (APIs) or batch processed into the EDW. Technologies like Apache Kafka or Google Cloud Pub/Sub can facilitate real-time data streaming for instantaneous insight generation. Once in the EDW, data can be correlated with HR databases (e.g., department, region, tenure) or CRM systems, providing rich demographic and organizational context to engagement metrics. Business Intelligence tools such as Tableau, Power BI, or custom web-based dashboards then query this aggregated data, allowing for multi-dimensional analysis. This integration enables questions like, “What was the average watch time for employees in the APAC region’s sales department during the Q4 earnings update?” to be answered with precision.
Real-time vs. Post-Event Analysis: Technical Architectures
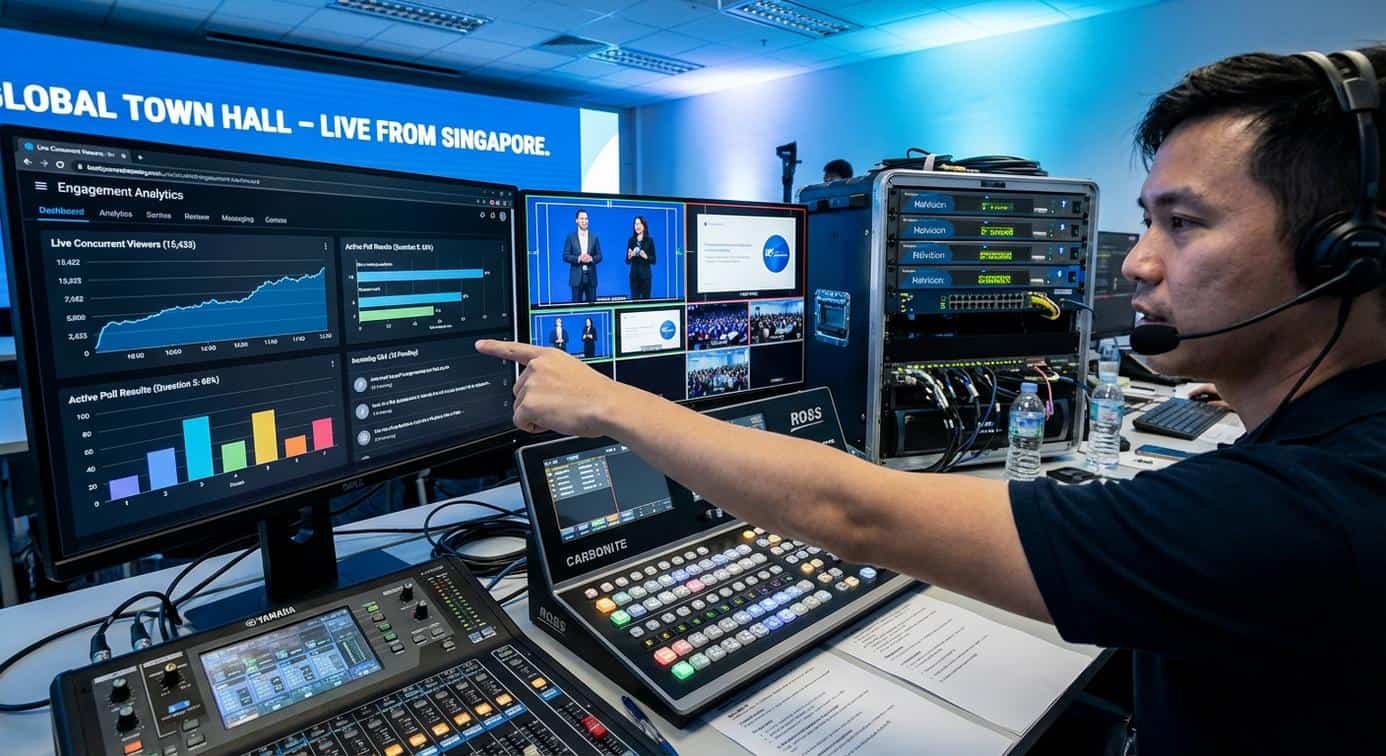
The requirements for real-time analytics during a live Town Hall differ significantly from post-event analysis. For real-time monitoring, a low-latency data pipeline is critical. This often involves in-memory databases (e.g., Redis, Apache Druid) and stream processing frameworks (e.g., Apache Flink, Spark Streaming) that can process high volumes of event data within milliseconds. This architecture enables production teams to observe concurrent viewer numbers, live Q&A submission rates, and immediate poll results, allowing for dynamic adjustments to the event flow, such as extending a Q&A segment if engagement is high. Post-event analysis, conversely, leverages more robust, often batch-oriented data processing systems for deep-dive investigations, trend analysis, and historical comparisons. This includes generating comprehensive reports on audience retention curves, peak engagement timestamps, and detailed interactive participation breakdowns. The technical challenge lies in designing a data pipeline that gracefully transitions between these two modes, ensuring data consistency and completeness.
Key Performance Indicators (KPIs) and Technical Measurement Methodologies
Defining success for an MNC Town Hall necessitates a clear set of KPIs, each underpinned by specific technical measurement methodologies. These extend far beyond simple viewership metrics to encompass active participation and content comprehension.
Audience Reach and Retention Metrics
- Unique Viewers/Participants: Measured via SSO integration or unique client IP addresses combined with browser fingerprinting (hashed). This establishes the total individual reach.
- Peak Concurrent Viewers: A critical performance metric, indicating the maximum number of simultaneous active streams. This informs infrastructure scalability requirements, specifically CDN capacity and origin server load.
- Average Watch Time (AWT) / Completion Rate: Calculated by aggregating client-side data on play duration and comparing it against total content duration. A high AWT or completion rate (e.g., 75%+) suggests sustained interest. Technical implementation involves robust event logging for play, pause, seek, and end events, with server-side reconciliation for accuracy.
- Viewer Drop-off Points: Granular time-series data illustrating exactly where viewers disengage. This requires time-stamped client-side
pauseorunloadevents, correlated with content metadata to identify specific moments or segments causing disengagement.
Interactive Engagement Metrics
- Q&A Participation: Number of unique questions submitted, number of upvotes on questions, and number of questions answered live. This measures active information seeking and direct dialogue.
- Polling/Survey Response Rates: Percentage of active viewers participating in polls or surveys. Technical tracking involves associating responses with unique user IDs and segmenting by demographic data.
- Chat Activity: Volume of messages, sentiment analysis of chat content (requiring Natural Language Processing, NLP, algorithms), and identification of key discussion topics. Moderation logs also provide valuable data on content relevance and participant behavior.
- Emoji Reactions/Likes: Simple, immediate feedback mechanisms providing real-time sentiment snapshots. Each reaction is a discrete, timestamped data point.
Technical Performance Metrics for QoE
While not direct engagement metrics, technical performance profoundly impacts engagement. Poor video quality or persistent buffering directly leads to viewer attrition.
- Buffering Ratio: Total buffering time divided by total viewing time. A ratio exceeding 0.5% typically indicates a degraded QoE. Monitored via client-side player API events.
- Average Bitrate Delivered: The actual bitrate at which content is consumed by viewers, reflecting adaptive bitrate (ABR) algorithm effectiveness and network capacity. Higher sustained bitrates equate to better visual quality.
- Latency: The delay between an event occurring live and its presentation to the viewer. For interactive Town Halls, low latency (e.g., <500ms via SRT or WebRTC) is crucial for real-time Q&A responsiveness.
- Geographic Performance Distribution: Analyzing QoE metrics by region to identify network bottlenecks or CDN configuration issues that disproportionately affect certain audience segments.
Ensuring Data Integrity and Scalability in Global MNC Town Hall Productions
The global nature of MNC Town Halls presents significant technical challenges regarding data integrity, privacy, and the scalability of analytics infrastructure. Adhering to strict compliance standards and architecting for high availability are paramount.
Global Data Governance and Compliance (GDPR, CCPA)
Capturing and processing personal identifiable information (PII) from employees across multiple jurisdictions requires strict adherence to data governance regulations such as GDPR in Europe and CCPA in California. This mandates anonymization or pseudonymization of data where appropriate, secure data storage, explicit consent mechanisms, and robust data access controls. Technically, this translates to implementing data masking at the ingestion layer, employing secure Hash-based Message Authentication Codes (HMAC) for user IDs, and utilizing geo-fencing for data storage to keep data within specific sovereign boundaries. The analytics platform must feature auditable logs to track data access and modifications, demonstrating compliance to internal and external auditors.
Scalability of Analytics Infrastructure for Peak Loads
A global MNC Town Hall can attract tens or even hundreds of thousands of concurrent viewers, each generating multiple client-side events per second. The analytics ingestion pipeline must be designed to handle these massive peak loads without dropped data or performance degradation. This necessitates horizontally scalable architectures utilizing cloud-native services like AWS Kinesis, Azure Event Hubs, or Google Cloud Dataflow for event ingestion and processing. Distributed NoSQL databases (e.g., Apache Cassandra, MongoDB) are often employed for their ability to scale out writes and reads across numerous nodes. Furthermore, the entire data processing pipeline, from edge collection points to central data warehouses, must be stress-tested rigorously under simulated peak load conditions, far exceeding expected maximum concurrency, to ensure system resilience.
Redundancy and Failover Strategies for Analytics Data Streams
Just as streaming content requires redundancy, so too do the analytics data streams. Loss of engagement data due to system failure is unacceptable, as it directly impacts post-event reporting and future strategic planning. Implementing redundant data pipelines, often involving active-passive or active-active configurations for critical services, is essential. For instance, event logs might be simultaneously written to two geographically dispersed data stores. Automated failover mechanisms must be in place to redirect data ingestion to a backup system in the event of a primary system outage. This ensures continuous data capture, even amidst infrastructure failures, safeguarding the integrity and completeness of the engagement analytics.
Actionable Insights: Translating Analytics into Enhanced Future Productions
The ultimate objective of comprehensive engagement analytics is to move beyond mere reporting to generate actionable insights that drive continuous improvement in MNC Town Hall production and content strategy. This involves a cyclical process of analysis, recommendation, implementation, and re-evaluation.
Content Optimization and Audience Segmentation
Detailed analysis of viewer drop-off points, coupled with content metadata, provides clear directives for content creators. If analytics consistently show disengagement during lengthy slide presentations or monologues, recommendations might include shortening segments, increasing speaker changes, or integrating more interactive elements. By segmenting audience data based on region, department, or seniority (where PII compliance allows), content can be tailored. For example, if European sales teams show high engagement with product roadmap discussions but low engagement with HR policy updates, future Town Halls can adjust the emphasis or format for different audience segments, potentially offering localized or targeted follow-up content streams. This requires sophisticated data modeling that correlates content attributes with segmented engagement metrics, often utilizing machine learning algorithms for pattern detection.
Infrastructure Refinement Based on QoE Metrics
Technical performance metrics offer concrete data for optimizing the streaming infrastructure. Persistent buffering in a specific region might indicate a need for additional CDN edge servers in that geography or a review of network peering agreements. Low average bitrates for a significant audience segment could point to bandwidth constraints at the corporate network ingress points or issues with adaptive bitrate (ABR) ladder configurations in the encoder. These insights lead to precise technical recommendations: upgrading network switches to 10 Gigabit Ethernet (10GbE) in specific offices, adjusting H.264/H.265 encoding profiles for broader compatibility, or implementing a dedicated Quality of Service (QoS) policy for streaming traffic across the Wide Area Network (WAN). Furthermore, monitoring latency figures provides critical feedback on the choice and configuration of streaming protocols; for highly interactive sessions, a shift towards WebRTC-based solutions or finely tuned SRT configurations might be warranted if RTMP introduces unacceptable delays.
Forecasting and Resource Planning for Future Events
Historical engagement data, including peak concurrent viewership and interactive participation rates, is invaluable for forecasting future event requirements. This allows production teams to accurately plan for CDN capacity, origin server scaling, encoding resources, and even human resourcing for moderation and technical support. By analyzing trends over several Town Halls, an MNC can anticipate periods of high demand and proactively provision resources, ensuring a flawless experience and cost-effective operation. For instance, if Q&A engagement consistently increases by 15% quarter-over-quarter, the interactive platform’s backend processing capacity and moderator staffing can be scaled accordingly. This data-driven resource planning minimizes the risk of system overload and optimizes operational expenditure, transforming reactive troubleshooting into proactive strategic infrastructure management.
In conclusion, the successful measurement of MNC Town Hall engagement transcends simple viewership; it is a sophisticated technical endeavor requiring a deep integration of streaming infrastructure, data analytics platforms, and enterprise IT systems. By meticulously capturing server-side and client-side data, adhering to global compliance standards, and employing advanced analytical methodologies, organizations can derive truly actionable insights. These insights empower corporate event planners, AV professionals, and IT directors to continuously refine their B2B event streaming strategies, optimize technical infrastructure, and ultimately, foster more impactful and engaging internal communications on a global scale. The investment in robust analytics is an investment in the strategic value and future success of enterprise communications.

Michael Koh is a production specialist and entrepreneur who founded Spring Forest Studio in 2017 to provide event and virtual production solutions in Singapore. He specialises in hybrid live streaming, XR (Extended Reality) virtual production, and studio systems integration, transitioning the business from traditional videography to advanced corporate broadcasting. Operating out of a dedicated facility at NordCom2 in Singapore, he leads a technical crew to deliver multi-camera webcasts, digital sets, and technical consultations for large-scale corporate events.